
Overview
Automating Excel reports with artificial intelligence means using tools like Microsoft Copilot, ChatGPT, and specialized AI reporting platforms to clean data, run analysis, and generate finished reports with minimal manual work. Instead of spending hours every week on formulas, pivots, and formatting, AI can turn raw spreadsheets into clear summaries, charts, and executive-ready outputs in a few prompts. microsoft
This guide explains how to use AI to automate Excel reports step by step, from preparing your data and choosing the right AI tool to designing reusable workflows and prompts. It is written for analysts, founders, operators, and managers who work in Excel regularly but do not want to become full-time Excel or VBA experts.
What “AI‑Automated Excel Reports” Really Means
“AI automation” in Excel covers more than just generating a one‑off summary of a spreadsheet. At a practical level it usually includes:
- Cleaning and structuring data (fixing formats, removing duplicates, flagging or filling gaps).
- Running recurring calculations, aggregations, and pivots without rebuilding them every reporting period.
- Generating written summaries and commentary from numbers (for example, monthly performance narratives).
- Creating visual elements like charts, tables, and dashboards that update when data changes.
- Packaging results into shareable outputs: refreshed Excel files, PDFs, slide decks, or emails.
The key shift is that you describe what you want in natural language and let the AI figure out the formulas, steps, and formatting needed to achieve it.
Why Automate Excel Reports With AI
Time savings and reduced busywork
Manually building recurring reports involves copying data, refreshing pivots, updating charts, checking formulas, and rewriting commentary. For weekly, monthly, or quarterly reporting this can easily add up to dozens of hours each month. Once your workflow is defined, AI assistants can refresh analyses and regenerate summaries in minutes instead of hours. energent
Fewer errors and more consistent logic
Repeated copy‑paste and manual formula editing are major sources of reporting errors. AI‑driven workflows can encapsulate reporting logic in prompts, rules, or templates so that each run applies the same checks and calculations. Tools like Copilot in Excel can also highlight outliers and inconsistencies that might indicate data issues. support.microsoft
Better insights from the same data
AI systems are strong at pattern recognition: spotting trends, correlations, and anomalies across thousands of rows is almost instant for them. Many AI Excel tools emphasize automated insights, narrative explanations, and suggested exploration paths, which can surface questions a human analyst might not have time to investigate. numerous
Lower barrier to advanced automation
Historically, full reporting automation meant learning VBA, Power Query, or external scripting. Large language models (LLMs) like ChatGPT can now write formulas, macros, and even full VBA procedures on demand, dramatically lowering the skill barrier. Non‑technical users can describe the desired behavior in plain language and let AI generate the technical implementation. dev
Preparing Your Excel Data for AI
AI tools work best when your spreadsheet follows some basic hygiene rules. Regardless of whether you use Copilot, ChatGPT, or a third‑party platform, a little setup goes a long way.
Use a tabular structure
Most AI Excel helpers assume data is in a table: one header row, one record per row, and no merged cells in the data region. Make sure that: easytweaks
- Each column has a clear, descriptive header.
- Different data types (dates, text, numbers) live in separate columns.
- There are no totals rows mixed into the raw data.
Standardize formats and categories
Inconsistent date formats, inconsistent labels (for example “USA” versus “United States”), and free‑text categories make automated analysis harder. Before involving AI, normalize:
- Date formats to a single standard.
- Category labels via lookup tables or data validation.
- Numeric fields so they use the same units (for example, all revenue in the same currency).
AI can help clean messy data, but giving it structured, consistent inputs increases reliability and reduces the chance of misleading outputs. youtube
Decide on the reporting grain and time frame
Clarify what a “row” in your data represents (transaction, daily summary, customer, product) and what period each report should cover (week, month, quarter). These design decisions will feed directly into your prompts and templates and keep your AI outputs aligned with stakeholder expectations.
Option 1: Automate Reports With Microsoft Copilot in Excel
Microsoft Copilot is a built‑in AI assistant in Microsoft 365 that can work directly inside Excel to analyze data, suggest formulas, summarize trends, and generate visuals. It is the most seamless option if your organization already uses Microsoft 365. microsoft
Enabling and accessing Copilot
Copilot is available to eligible Microsoft 365 subscribers and appears as a button on the Excel ribbon and as a sparkle icon beside certain cells. Once it is enabled in your tenant and license, you can: support.microsoft
-
- Open a workbook with your prepared data.
- Click the Copilot icon on the Home tab to open the assistant pane.
- Select conversation starters or type your own requests in natural language.
Example prompts for automated reporting
Once your data is formatted as a table, prompts like these can generate recurring reports:
- “Summarize month‑over‑month sales performance by region and highlight the top three regions by growth.”
- “Create a pivot table that shows total revenue by product category and month, then generate a line chart.”
- “Identify any outlier transactions above 3 standard deviations from the average order value and list them in a new sheet.”
Copilot can respond with summaries, formulas, pivot tables, charts, or combinations of these. For recurring use, save the resulting workbook as a template, then each period simply paste in new raw data and rerun the same instructions. microsoft
Strengths and limitations of Copilot
Strengths:
-
- Native access to data in Excel, OneDrive, and SharePoint.
-
- Ability to generate and explain formulas, making it a learning tool as well as an assistant.
-
- Tight integration with other Microsoft 365 apps for exporting results into Word, PowerPoint, or email workflows.
Limitations:
-
- Availability depends on Microsoft 365 licensing and organizational policies.
- Data stays within the Microsoft ecosystem; connecting to external systems may still require Power Query, Power Automate, or other integrations.
- Prompts are session‑based; for fully scheduled automation you may need to combine Copilot with other orchestration tools.
Option 2: Use ChatGPT or Other LLMs With Excel
Large language models accessed via tools like ChatGPT can assist with Excel reporting even outside of native integrations. Common patterns include generating formulas, writing VBA or Office Scripts, summarizing data, and drafting report narratives. clickup
Copy‑paste workflow for summaries and insights
For one‑off or lightweight automation, you can:
-
- Export or copy a slice of your Excel data (for example, a CSV export or a table copied to the clipboard).
- Paste it into an LLM interface or upload it if the tool supports file inputs.
- Prompt the model to analyze and summarize the data.
- Paste the resulting narrative or key metrics back into Excel or a report document.
Excel add‑ins and web tools like Numerous.ai streamline this workflow by connecting Excel directly to ChatGPT‑style models and returning results into your spreadsheet. numerous
Prompt patterns for automated reporting
Structured prompts yield more consistent outputs. A useful pattern is:
- Context: what the dataset represents.
- Task: what report you need.
- Constraints: time period, breakdowns, metrics.
- Output format: headings, bullet points, tables.
Example prompt:
You are an Excel reporting assistant.
I have a table of sales transactions with columns: Date, Region, Product, Revenue, Channel.
Create a monthly performance summary for the last 3 months that includes:
- Total revenue by month and by region
- Top 5 products by revenue overall
- 3–5 bullet insights about notable changes
Return the result as:
1) A short executive summary (under 150 words)
2) A markdown table with revenue by region and month
Once refined, save this prompt as a template and reuse it each period with updated data.
Generating formulas, macros, and scripts
LLMs can also automate the technical layer of Excel reporting:
-
- Generate complex formulas based on natural‑language descriptions.
-
- Write VBA macros that clean data, refresh pivots, and export PDFs.
- Produce Office Scripts for web‑based automation in Excel on the web.
Here is an example prompt for a macro:
You are an expert Excel VBA developer.
Write a VBA macro for the following workflow:
- Assume there is a sheet called 'RawData' with a formatted table of sales transactions.
- Refresh all pivot tables in the workbook.
- Update all charts that reference those pivots.
- Export the sheet 'Executive_Report' as a PDF to the same folder as the workbook.
Comment the code so a non-developer can understand what each section does.
Always review and test any generated code in a safe environment before using it on production workbooks.
Option 3: Dedicated AI Platforms for Excel Reporting
Several SaaS platforms focus specifically on automating Excel‑based reporting workflows with AI. These tools typically connect to Excel, CSVs, or databases, then orchestrate data cleaning, analysis, visualization, and distribution. formulabot
Examples of AI reporting platforms
-
- Energent.ai: Automates data cleanup, pivot refresh, chart building, and scheduled export of Excel and PDF reports.
-
- FormulaBot: Uses AI to generate formulas, analyze data, and create formatted reports that can be exported back to Excel or other formats.
-
- Powerdrill Bloom: Accepts Excel or CSV uploads, automatically analyzes the data, generates visual reports, and exports insights as slides or documents.
Each platform has its own focus (operations, marketing, finance, general analytics), so select one that matches your reporting domain and tech stack.
Typical end‑to‑end workflow in these tools
A common pattern looks like this:
-
- Connect a data source (Excel, CSV, Google Sheets, database) or upload files.
-
- Define rules or prompts for cleaning, aggregations, and KPIs.
- Choose or design report templates (for example, weekly sales dashboard, financial performance pack).
- Schedule refresh runs (daily, weekly, monthly) and distribution (email, shared folders, slide exports).
- Monitor results and adjust prompts or templates as business needs evolve.
These tools are especially useful when many stakeholders rely on consistent, recurring reports but the organization lacks bandwidth to build and maintain custom BI pipelines.
Designing a Reusable AI‑Powered Reporting Workflow
Regardless of the specific AI tool, long‑term leverage comes from designing a reporting workflow that can be reused and iterated rather than rebuilt from scratch each period.
Step 1: Define your reporting questions and KPIs
Start from decisions, not from data. Clarify what questions your report must answer and what metrics matter. For example:
- “How did revenue change by region compared to last month?”
- “Which product lines drove most of the growth?”
- “Are there emerging risks or anomalies we should investigate?”
These questions guide what tables, charts, and narratives the AI should generate.
Step 2: Standardize inputs
Design your source spreadsheets so that—even if data is imported from different systems—each reporting cycle receives data in a consistent schema. This might involve:
- Fixed column names and order.
- Known locations for parameters (for example, a “Settings” sheet with current period, currency, thresholds).
- Clear separation of raw data, intermediate calculations, and final presentation sheets.
Standardization makes prompts more stable and reduces prompt engineering overhead.
Step 3: Create prompt and template libraries
Treat prompts and report layouts as reusable assets. Maintain a small library of:
- Analysis prompts (for example, “Monthly performance summary for sales data”).
- Data‑cleanup prompts (for example, “Normalize region names and flag invalid dates”).
- Narration templates (for example, “Executive summary structure” with placeholders).
Over time, refine these assets based on real outputs and stakeholder feedback.
Step 4: Add orchestration and scheduling
To go beyond semi‑manual automation, connect AI analysis steps to workflow tools:
- Use Power Automate, Zapier, or n8n to trigger report runs when new files land in a folder or when a period closes.
- Call LLM APIs from scripts that fetch fresh data, send it for analysis, and write back results.
- Combine AI‑generated commentary with BI dashboards for a more complete picture.
This is where Excel reports transition from analyst‑driven tasks to repeatable, system‑driven processes.
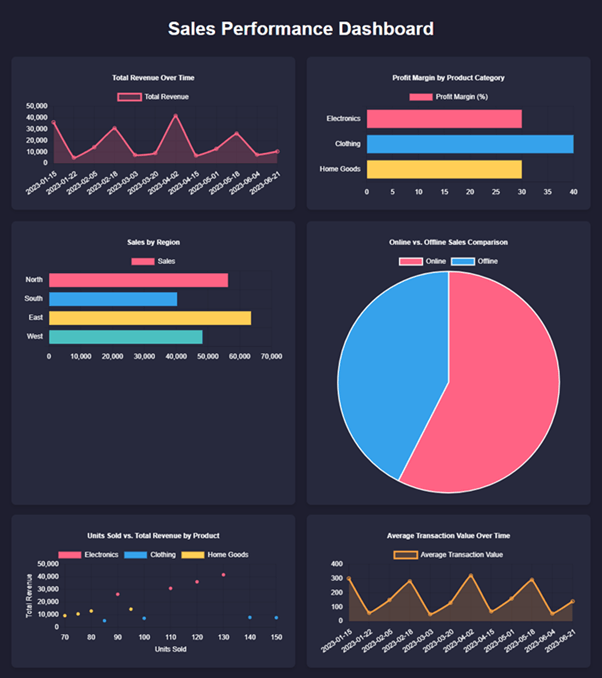
Example: Monthly Sales Report Automation
To make the concepts concrete, consider automating a monthly sales report.
- Input: A transactional sales export with Date, Region, Customer, Product, Revenue, and Channel.
- Excel structure: Raw data on one sheet, a standardized pivot/dataset on another, and an “Executive_Report” sheet formatted for presentation.
- AI steps:
-
- Use Copilot or an LLM‑driven script to build or refresh a pivot table summarizing revenue by month and region.
[microsoft](https://www.microsoft.com/en-us/microsoft-365/excel/ai-for-excel)
- Ask the AI to generate a narrative summary of key changes since last month, including top‑growing regions and products.
- Have the AI create or update charts that illustrate these trends.
-
- Output and distribution:
- Export the report sheet as a PDF.
- Email it automatically to stakeholders or upload to a shared location.
With this setup, each new month mostly involves dropping updated raw data into the “RawData” sheet and triggering the workflow.
Best Practices and Common Pitfalls
Best practices
- Start small: Automate one recurring report first, then expand to others once the pattern works.
- Keep a human in the loop: Treat AI as a junior analyst; review its outputs, especially early on.
- Document assumptions: Note which columns, filters, and business rules each prompt or script expects.
- Version prompts and templates: Track changes so you can roll back if a new version underperforms.
Pitfalls to avoid
-
- Overtrusting outputs: AI can produce confident but incorrect summaries, especially if data is noisy or mis‑structured.
- Ignoring data governance: Ensure that any external AI tool you use complies with your organization’s security and privacy policies. Avoid uploading sensitive data to tools without proper agreements.
- Underestimating setup: Poorly structured spreadsheets lead to messy automation. Invest time in data hygiene even if AI can help clean it.
Optimizing This Topic for AI Overviews and Search
If you are publishing documentation or blog posts about how to use AI to automate Excel reports, structure them so that search engines and AI overviews can extract clear answers. Use direct, answer‑style headings that mirror user queries (for example, “How to use AI to automate Excel reports”). Provide concise definitions and step lists near the top of the article before going into deeper detail. Include concrete examples, prompts, and tool names to anchor abstract concepts. clickup
FAQ sections with question‑style headings also help capture long‑tail queries like “Can I use AI in Excel without coding?” or “Is my data safe when I use AI?” and make your content more scannable.
FAQ
Can I automate Excel reports with AI without knowing VBA?
Yes. Tools like Copilot in Excel, ChatGPT‑powered add‑ins, and dedicated AI reporting platforms all allow natural‑language interaction without requiring you to write code. numerous
Is my data safe when I use AI to automate reports?
Safety depends on the tool. Native options like Copilot keep data within the Microsoft 365 environment, while third‑party services may transmit data to their servers. Always review security documentation and data‑handling policies before uploading sensitive information. powerdrill
How is this different from using a BI tool like Power BI or Tableau?
BI platforms excel at building interactive dashboards and complex models, but they often require more setup and specialized skills. AI‑driven Excel automation is lighter‑weight, reuses existing spreadsheets, and is well suited to teams that already live in Excel but want faster, smarter reporting.
What is the quickest way to start?
For most Excel users on Microsoft 365, the fastest starting point is enabling Copilot, formatting data as tables, and experimenting with a few simple prompts for summaries and charts. If Copilot is not available, try a ChatGPT‑style workflow where you paste sample data and ask for a narrative report before investing in dedicated platforms. clickup
